The first Greenspan and Kennedy paper (*), published in 2005 provides figures about equity extraction in the US over the 1990 to 2005 period. In the first diagram, the numbers for cash-out extracted at the occasion of refinancing are shown along origination of Home Equity Loans and Lines of Credit. There is no essential difference of course between the two about the way equity is extracted: in both cases the home is used as collateral: cash-out raises the amount of the mortgage, the so-called “first lien” on the house while Home Equity Loans and Lines of Credit establish a “second lien” on the property. Contrary to common perception, apart in the period 1995-1998, cash-out has been much more significant than Home Equity.
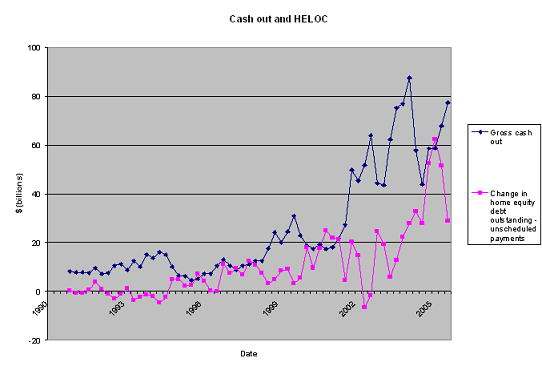
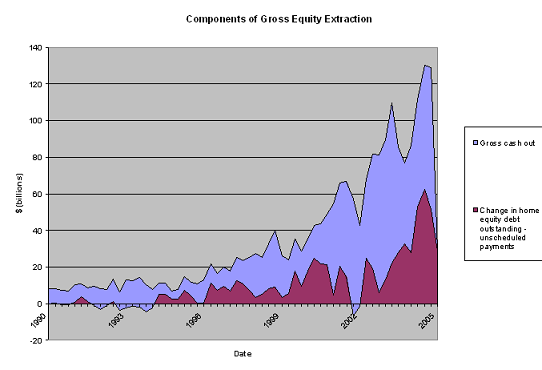
The first diagram makes it easy to compare the volumes of cash-out and Home Equity. In the second diagram, these volumes have been added, showing their combined effect.
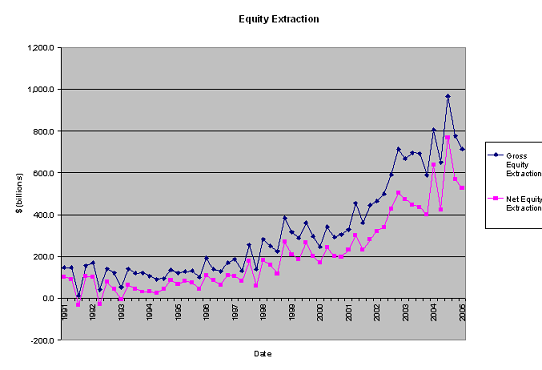
The third diagram emphasizes the well-known saying that there is no free lunch as the costs involved in equity extraction are deducted from gross equity extraction to show net equity extraction. The cost deduction seems fairly constant in actual terms over time; when equity extraction is small the cut may eat up most of the amount, as in the 1991 to 1993 period.
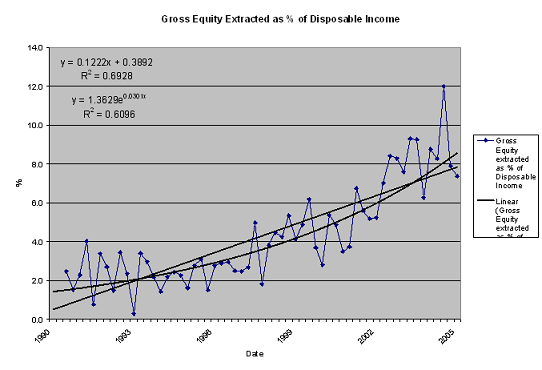
That equity extraction grew with the housing bubble rather than with the economy as a whole is best seen in diagram 4 where equity extraction over the years is compared with disposable income. A linear and an exponential trend lines have been added to the data points. The fit of the linear trend offers a slightly better fit. The trend was decidedly upwards over the period depicted; as is obvious by now, the figures for 2007 will show an amplification of the reversal in the trend that was initiated in 2006.
The second Greenspan and Kennedy paper (**), published a fortnight ago, updates the 2005 figures for 2006. There is also a shift in emphasis towards an examination of the net proceeds from existing home sales and the uses for the equity extracted from housing. Diagram 5 shows the allotment of these main uses: purchasing a new home, personal consumption expenditures and financial investments comprising – as we will see – debt consolidation.
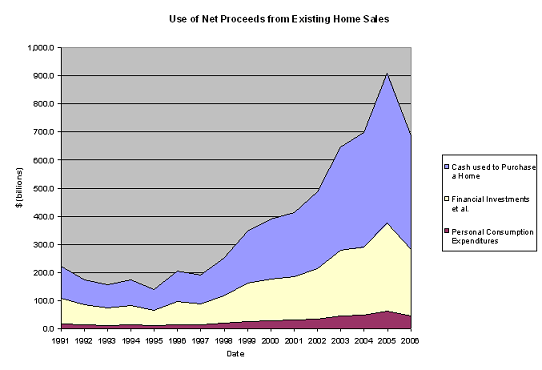
The scale of diagram 5 makes personal consumption expenditures difficult to assess; diagram 6 shows personal consumption expenditures on their own, making the yearly fluctuations in volume more visible. Personal consumption expenditures from equity extraction have clearly been inflating along with the bubble
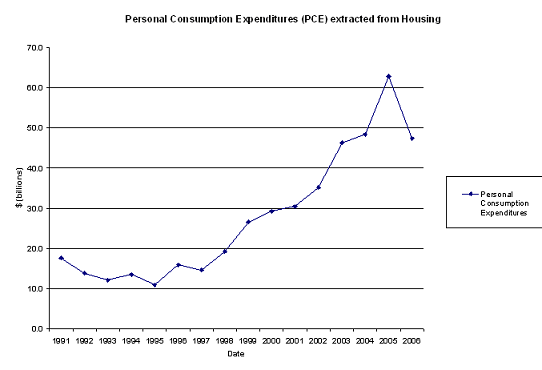
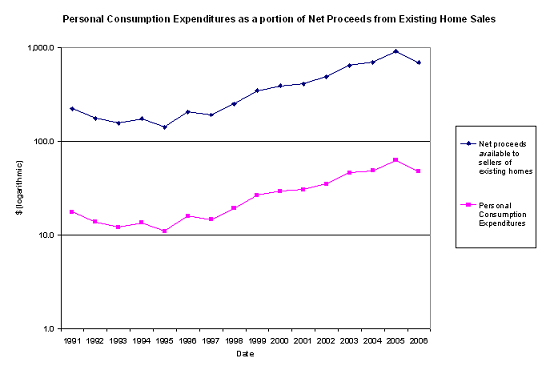
Diagram 7 contains essentially the same information as diagram 5; the dollar scale has however been made logarithmic so that personal consumption expenditures are not dwarfed by net proceeds from existing home sales. It is clear from the graph that personal consumption expenditures followed very much in step with net proceeds as a nearly constant fraction of the extended category.
A logarithmic scale has been used again in diagram 8 to make the change in volumes more easily discernible when personal consumption expenditures are compared with house value. Contrasting the exponents of the exponential curves fitting the data (being displayed flat as the y axis has a logarithmic scale) shows personal consumption expenditures growing faster than house value.
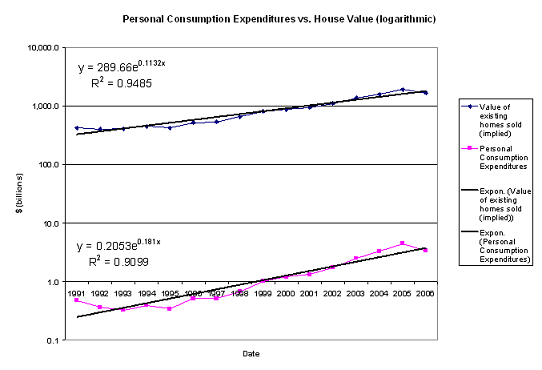
Diagram 9 is very much a summary of what has been analyzed earlier.
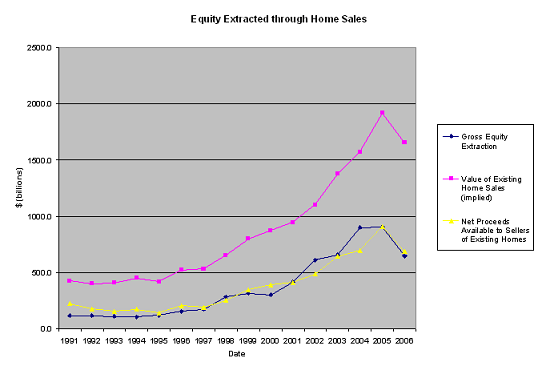
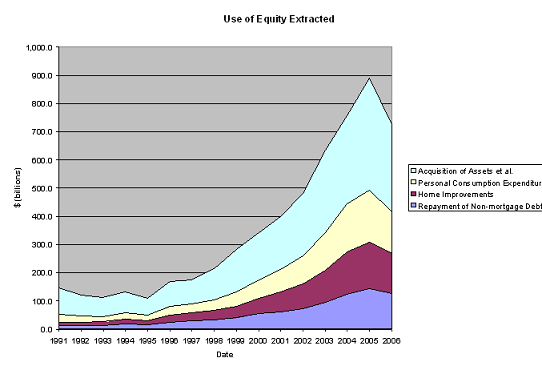
Diagram 10 shows the various uses for the equity extracted. The “Investments, etc.” category of the 2005 paper has been broken down here into “Acquisition of assets,” like Mutual Funds and “Repayment of non-mortgage Debt,” i.e. debt consolidation.
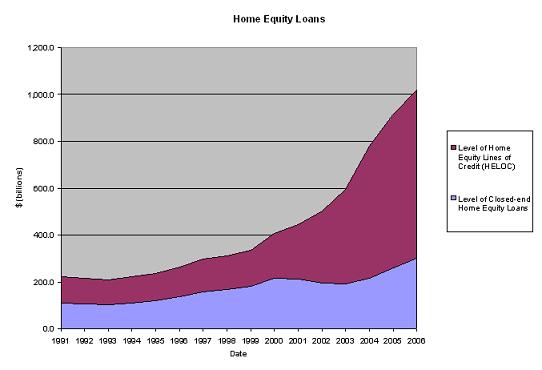
Finally, diagram 11 shows the cumulative volume of Home Equity Loans and Lines of Credit. March 2007 (not visible here) was the first month since 1999 showing a slowdown in their volumes.
(*) Alan Greenspan and James Kennedy, Estimates of Home Mortgage Originations, Repayments, and Debt On One-to-Four-Family Residences, Finance and Economics Discussion Series, Divisions of Research & Statistics and Monetary Affairs, Federal Reserve Board, Washington, D.C., 2005-41
(**) Alan Greenspan and James Kennedy, Sources and Uses of Equity Extracted from Homes, Finance and Economics Discussion Series, Divisions of Research & Statistics and Monetary Affairs, Federal Reserve Board, Washington, D.C., 2007-20
3 responses to “The Greenspan and Kennedy papers on Equity Extraction from Housing (1990-2006) – A graphic exposition”
Hi everyone
Check out an excellent video :
http://www.youtube.com/watch?v=Z7jUnptjqZE
Bye to everyone!
maik midlooks
the greenspan and kennedy has done very good work by publishing papers best on graphical method . this method shows that invester have to be petient about their invesment it is a long term processe dont use it short terms you will get procede.
Excellent article , i just share it with my friend of Italy. I Stumble UP your blog post , you will notice an increase of traffic within 24 hours for targeted people. Cheers